Reverse · 5 of 12
Empirical Robustness Profile
How quickly does the decision degrade as perturbation strength increases?
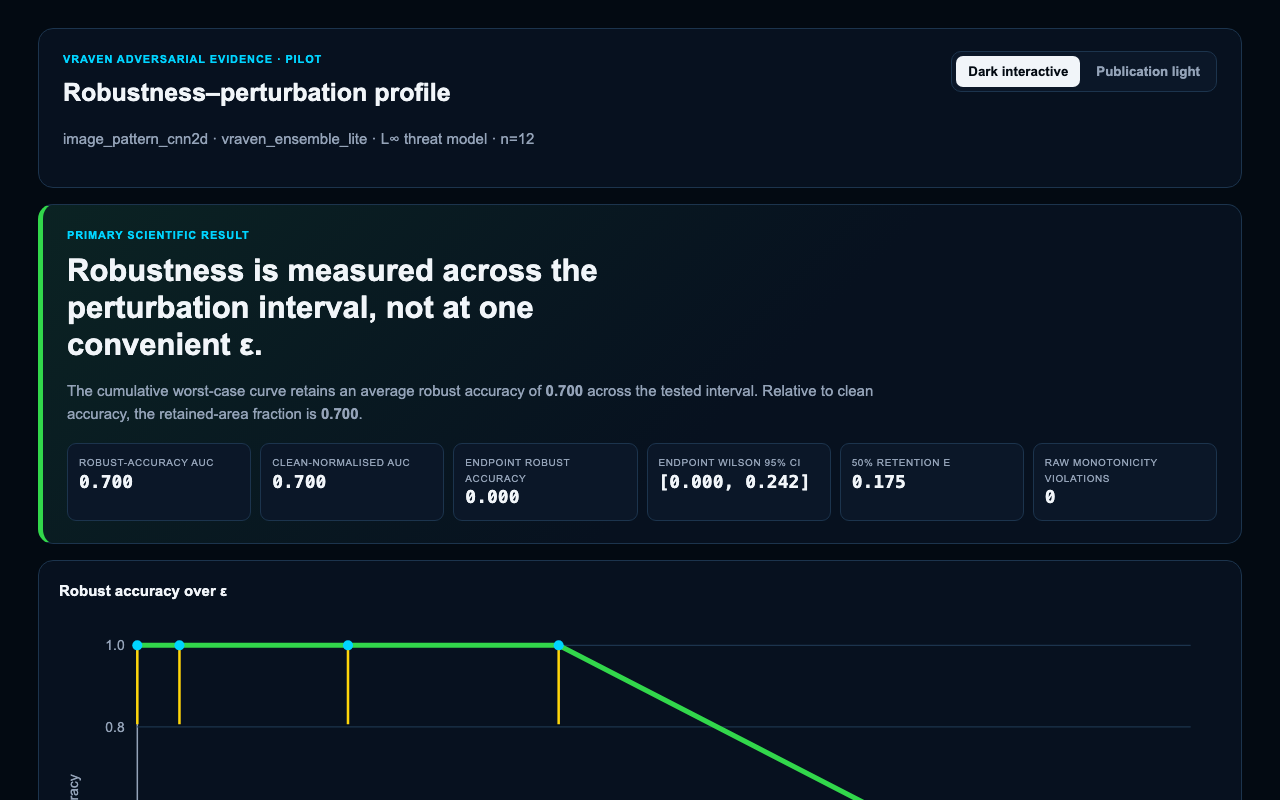
What it shows
An empirical curve linking perturbation strength to prediction and mechanism behaviour.
Claim boundary
Empirical sampling can miss attacks; it is not a formal robustness guarantee.
Run this with the installed CLI
Point VRAVEN at a validated model bundle. This produces one focused HTML report and works after a normal PyPI installation.
vraven analyse ./my-model \
  --task explain \
  --preset standard \
  --format html \
  --output vraven-report.html
Start with the model-folder guide if your bundle is not prepared yet. The larger documentation fixture is a contributor workflow described in Develop from source.
Generate this view
AdversarialAuditor(model).audit_robustness_curve(input_tensor, target=target).write_html(output_path)InputModel bundle, one reference input, selected target
Display mode
publication_lightEvidence levelObservational or descriptive
Machine output
reverse/adversarial_robustness_profile.htmlRelated APIvraven.AdversarialAuditor
Fixture
image_pattern_cnn2dHow to read the result
- Start with the title and target metadata in the generated report.
- Read the strongest structures first, then inspect weaker or opposing evidence.
- Check the stated evidence level and status before treating a relationship as causal or formal.
- Retain the trace, model version, preprocessing, and VRAVEN version with any published claim.
Reproducibility noteThe screenshot is public documentation evidence. The source run remains local-first; raw provenance files are not published because they can contain machine paths.