Atlas · 1 of 4
Activation Community Graph
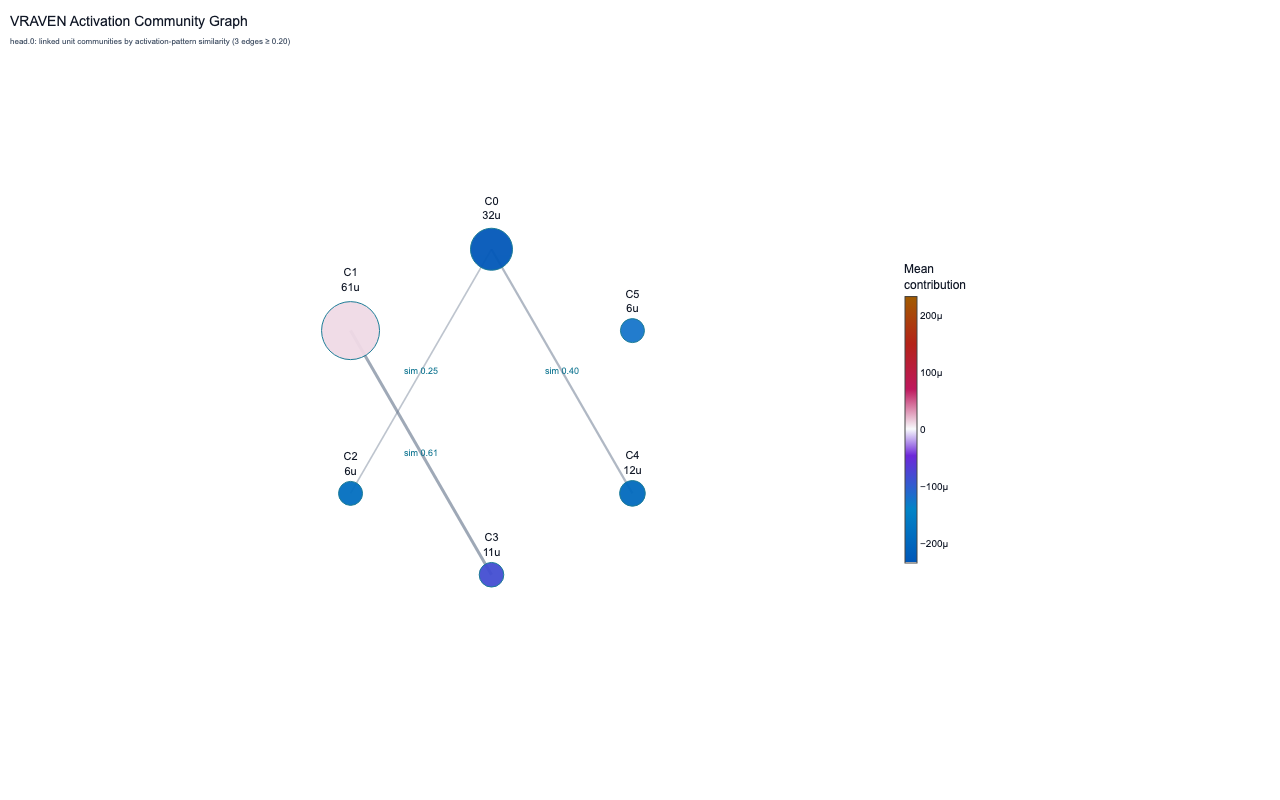
Which samples share activation communities?
What it shows
A cohort-level map derived from per-sample reasoning signatures.
Claim boundary
Cohort geometry depends on sampling, representation, and distance choices.
Run this with the installed CLI
Point VRAVEN at a validated model bundle. This produces one focused HTML report and works after a normal PyPI installation.
vraven analyse ./my-model \
  --task explain \
  --preset standard \
  --format html \
  --output vraven-report.html
Start with the model-folder guide if your bundle is not prepared yet. The larger documentation fixture is a contributor workflow described in Develop from source.
Generate this view
# Use the typed result object returned by the matching analysis.
figure = atlas.figure("activation_community_graph", mode="publication_light")
figure.write_html("result.html")InputModel bundle, one reference input, selected target
Display mode
publication_lightEvidence levelObservational or descriptive
Machine output
atlas/activation_community_graph.htmlRelated APIvraven.DatasetAtlas
Fixture
image_pattern_cnn2dHow to read the result
- Start with the title and target metadata in the generated report.
- Read the strongest structures first, then inspect weaker or opposing evidence.
- Check the stated evidence level and status before treating a relationship as causal or formal.
- Retain the trace, model version, preprocessing, and VRAVEN version with any published claim.
Reproducibility noteThe screenshot is public documentation evidence. The source run remains local-first; raw provenance files are not published because they can contain machine paths.
Start of familyNext (J) →